HomeJavaModssaddle
saddle
ModsJava

saddle

Saddle: A Datapack Debugger for Live Editing

⬇ Download on Modrinth
saddle — screenshot 1

Saddle

Saddle: A Datapack Debugger for Live Editing

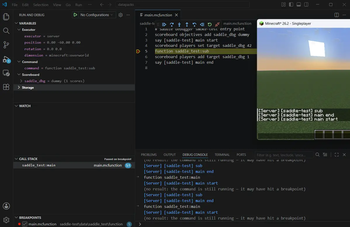
A Fabric mod that embeds a Debug Adapter Protocol server in Minecraft, so datapack .mcfunction files can be debugged from VS Code (or any DAP client) — breakpoints, stepping, time travel, and live inspection and editing of the game state your functions run against.

In Minecraft, a saddle is what lets you take the reins of something that otherwise runs on its own. This mod puts a saddle on datapack execution: stop it where you want (breakpoints), back it up (time travel), and steer it (live edits) — instead of watching it gallop by.

Quick start

  1. Install the mod (plus Fabric API) and start a world or server.

  2. Install the VS Code extension Saddle — Minecraft Datapack Debugger from the Marketplace (or search "Saddle" in the Extensions view). To build it from source instead:

    cd vscode-extension
    npx --yes @vscode/vsce package --allow-missing-repository
    code --install-extension saddle-debug-*.vsix
    
  3. Open your datapack folder in VS Code, set breakpoints in .mcfunction files, and run Attach to Minecraft (Saddle) (or press F5). The Debug Console and game chat both announce which world you attached to.

  4. Trigger a function in game, from a tick function, or straight from the Debug Console.

See vscode-extension/README.md for the editor-side feature tour.

How it works

DAP support

Area Requests
Lifecycle initialize, launch/attach, configurationDone, disconnect
Breakpoints setBreakpoints, breakpointLocations — plain commands and macro lines; comment/blank lines shift to the next executable line
Execution continue, next, stepIn, stepOut, pause
State threads, stackTrace, scopes, variables, setVariable, source
Console evaluate — runs any command, responding asynchronously so a command that hits a breakpoint never delays the stack view; while suspended it executes in an isolated ExecutionContext. completions serves Brigadier suggestions, so the Debug Console autocompletes like the in-game chat
Hover evaluate(context: hover) resolves macro arguments ($(name)), entity selectors (@e[...]) and coordinate triples (~ ~2 ~) without executing commands
Output in-game chat is mirrored to the client as output events: system broadcasts (/say, deaths, joins), player chat, and per-player messages (/tellraw, /msg)
Time travel stepBack / reverseContinue navigate a recording of executed commands (ring buffer, -Dsaddle.ttd.steps, default 20k). While in the past, the stack, executor, macro arguments and reconstructed scoreboard/storage state are shown for that moment — the scopes keep their live names so expanded rows survive moving between present and history, and the Executor scope carries a (time travel) marker. Forward stepping replays the recording back to the present; continue past the recording resumes live execution. saddle/trace returns the recent execution trace

Variables ("registers & memory")

Each stack frame exposes live scopes, all reading game state while stopped:

Hovering over $(name), @e[...] or 1 2 3/~ ~2 ~ in a .mcfunction file while stopped shows the same data inline (via the VS Code extension).

Watch & pin expressions

The VS Code WATCH panel, the pinned "Watched" scope (saddle/pin, saddle/unpin, saddle/pins) and the Saddle Watch view all accept:

Saddle Watch (real time + editable, no breakpoint required)

The extension adds a Saddle Watch view to the Run and Debug sidebar — one watch panel that does what WATCH and Variables do together, without needing a breakpoint:

To keep a single watch panel, hide the built-in one once: right-click any section header in the Run and Debug sidebar and uncheck Watch — VS Code remembers. (Extensions cannot remove or replace built-in views, and the built-in WATCH only re-evaluates when the debugger stops; both are platform limits. Drag Saddle Watch to WATCH's old spot and the layout also sticks.)

Custom requests

Testing

# first time only: accept the EULA and disable the tick watchdog
mkdir -p run
printf 'eula=true\n' > run/eula.txt
printf 'max-tick-time=-1\nonline-mode=false\npause-when-empty-seconds=0\n' > run/server.properties

./gradlew runServer                 # terminal 1
python3 scripts/dap_smoke_test.py   # terminal 2

The script installs scripts/test-datapack into the world, /reloads, and exercises the full debug loop end to end (108 checks): breakpoints, stepping, time travel (step back / reverse continue / historical state reconstruction), macro breakpoints and macro-argument values, comment-line shifting, live variable read/write (scoreboard, storage NBT, entity NBT), selector/coordinate resolution, hover evaluation, console completions, chat output mirroring, entity/block data requests, evaluate and pause. CI runs the same suite against a real dedicated server, and pushing a v* tag publishes the jar and vsix as a GitHub Release.

Notes

Troubleshooting

Verified by MCModsHub

These come from our own check of the pack file, not from the source page.

Explore more